VOL. 19, NO. 1 / WINTER 2024 / URNER BARRY'S REPORTER • 17
Strategically positioned to provide
advantageous logistics solutions for
importers of refrigerated goods
Located less than 40 miles from the country's
Located less than 40 miles from the country's
largest reefer hub at the Port of Philadelphia
largest reefer hub at the Port of Philadelphia
USDA Import and Domestic Inspection
FDA Registered • Blast Freezing • Tempering
Thawing and Deboxing (cases to combos)
11,000 Frozen Pallet Positions
8,000 Frozen (00 F) and 1000 Chilled (280 F)
pallets opening mid-to-late 2024
acfreezers.com • 856-696-1770
HOW CAN MINTEC HELP?
World-leading analysts at Mintec have created
the following services within the Mintec
platform to help procurement leaders and
teams weather the weather, better.
Negotiation-Ready Data
Stay ahead in negotiations by
understanding the weather's impact
on crops and the consequential
effects on pricing, allowing for more
strategic procurement decisions.
Historical Insights for Informed Procurement
Gain historical data and insights to
anticipate crop quality and quantity, based
on past performance, helping you make
informed decisions.
Market Stability Assessment
Understand market stability by assessing
potential supply challenges, pricing
fluctuations, and disruptions, allowing you to
proactively address these issues.
Global Crop Impact Overview
Receive concise monthly reports summarizing
the impact of adverse weather conditions on
crops worldwide ensuring a comprehensive
understanding on the global market.
Condensed, In-Depth Information
Access all the relevant information in one place
featuring detailed coverage of various weather
patterns, such as storms, droughts, and heat,
equipping you with insights into the quality,
availability, and pricing trends of commodities.
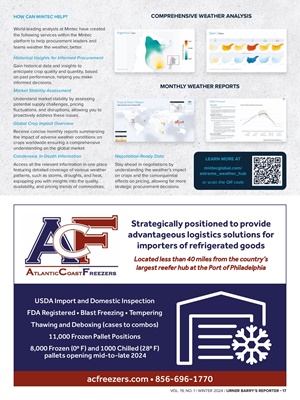
COMPREHENSIVE WEATHER ANALYSIS
MONTHLY WEATHER REPORTS
Weather Maps
Precipitation, Minimum Temperature and Maximum
Temperature. The colours represent monthly
weather anomalies or % changes compared to 30
years averages.
• Crop maps show the major growing areas of
the commodity for agricultural crops.
• Country maps for all other commodities.
Precipitation (% change)
Lower
Average
Higher
Argentina | Corn
November, 2019
Spain | Olives
Nov, 2019 to Apr, 2020 (Example of low yield 2012)
Weather Maps
Precipitation, Minimum Temperature and Maximum
Temperature. The colours represent monthly
weather anomalies or % changes compared to 30
years averages.
• Crop maps show the major growing areas of
the commodity for agricultural crops.
• Country maps for all other commodities.
e
North Atlantic
Ocean
Arctic
Ocean
South Atlantic
Ocean
Indian
Ocean
North Pacific
Ocean
South Pacific
Ocean
Goni
Iota
Eta
Vamco
Gati
Nivar
Astani
Etau
Potential Impact to Crops
High Goni, Iota, Eta, Vamco
Eta
Nivar, Atsani, Etau
Medium
LowTropical Storm Report
/ Major tropical storm events / November 2020
Copyright © 2020 Mintec Limited Source: NASA
Storm Cate ory Wind Speed (mph)
Tropical Storm 39-73
Cat 1 74-95
Cat 2 96-100
Cat 3 111-119
Cat 4 130-156
Cat 5 <156
Marian
Storm Outlook
Tropical Cyclone Marian
Category 3
Indian Ocean
No major land damage
Comparison Years
Comparison years allow the user to see how the
current year compares to historical years when the
From this comparison year example you could infer
that the prolonged colder than normal weather at
the start of 2012 impacted the olive yield in this
season. The current year displayed has not had that
same colder period, but a warmer than average
winter, therefore, may have avoided this
weather concern.
Spain | Olives
Nov, 2019 to Apr, 2020 (Example of low yield 2012)
• The 2023 El Niño is forecast to peak between December
2023 and January 2024
• There is some variation in model predictions from across
the world, ranging from a Strong El Niño event to a Very
Strong El Niño event. The average forecast is for a Very
Strong El Niño event
• Three historicalVery Strong El Niño eventsare chartedto
compare with current forecasts. The forecasts are
trendingsimilarlyto the historicalevents
• These eventsbroughtstrongglobalimpactsincluding:
• Low water levels in the Panama Canal due to Central
Americandrought
• Reduction in cold water fish stocks as they move to more
favourablewaters
• Above-normal rainfall in the United States and southern
South America, which can be beneficial for growth, but can
also be negativefor maturingcrops if excessive
• Below-normal rainfall in northern South America, South
Africa, India, Southeast Asia and Australia,which is negative
for many crops in these regions. It can be especially
impactfulfor PalmOil and Rice
-2
-1
0
1
2
3
Data Sources NOAA, Copernicus, NASA, Australian Bureau of
Meteorology, Government of Canada, Japan Meteorological Agency
• The chart includes some of the forecast models shown by dotted
lines. The average of these models is shown as a black dashed line
• Forecasts are compared to the three Very Strong El Niño years
recorded since 1975 (82/83, 97/98, 15/16)
LEARN MORE AT
mintecglobal.com/
extreme_weather_hub
or scan the QR code