42 • URNER BARRY'S REPORTER / VOL. 18, NO. 4 / FALL 2023
Vegetable oils make up a key part of
fish and seafood processors' cost of
production, as they are mainly used as an
ingredient in canned fish to help retain vital
nutrients and differentiate products (oil,
water or brine used as a carrier in the can).
The increase in vegetable oil prices over
the last few years, due to disruptions from
the COVID-19 pandemic and the RussiaUkraine conflict, have reportedly been
passed along the global seafood supply
chain as seafood processors continue to
deal with elevated raw material prices.
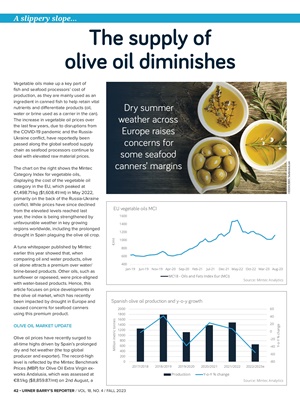
The chart on the right shows the Mintec
Category Index for vegetable oils,
displaying the cost of the vegetable oil
category in the EU, which peaked at
€1,498.71/kg ($1,608.41/mt) in May 2022,
primarily on the back of the Russia-Ukraine
conflict. While prices have since declined
from the elevated levels reached last
year, the index is being strengthened by
unfavourable weather in key growing
regions worldwide, including the prolonged
drought in Spain plaguing the olive oil crop.
A tuna whitepaper published by Mintec
earlier this year showed that, when
comparing oil and water products, olive
oil alone attracts a premium over water/
brine-based products. Other oils, such as
sunflower or rapeseed, were price-aligned
with water-based products. Hence, this
article focuses on price developments in
the olive oil market, which has recently
been impacted by drought in Europe and
caused concerns for seafood canners
using this premium product.
OLIVE OIL MARKET UPDATE
Olive oil prices have recently surged to
all-time highs driven by Spain's prolonged
dry and hot weather (the top global
producer and exporter). The record-high
level is reflected by the Mintec Benchmark
Prices (MBP) for Olive Oil Extra Virgin exworks
Andalusia, which was assessed at
€8.1/kg ($8,859.87/mt) on 2nd August, a
A slippery slope… The supply of
olive oil diminishes
400
600
800
1000
1200
1400
1600
Jan-19 Jun-19 Nov-19 Apr-20 Sep-20 Feb-21 Jul-21 Dec-21 May-22 Oct-22 Mar-23 Aug-23
€/mt
EU vegetable oils MCI
MC18 - Oils and Fats Index Eur (MCI)
Source: Mintec Analytics
-80
-60
-40
-20
0
20
40
60
0
200
400
600
800
1000
1200
1400
1600
1800
2000
2017/2018 2018/2019 2019/2020 2020/2021 2021/2022 2022/2023e
Y-o-Y % change
Million metric tonnes Spanish olive oil production and y-o-y growth
Production Y-o-Y % change
Source: Mintec Analytics
Dry summer
weather across
Europe raises
concerns for
some seafood
canners' margins
©DUSAN ZIDAR / Shutterstock.com